

Seven months of signal
Seven months in, the cumulative lens gets sharper. The advantage of this view over any individual month is simple: one unusual sale, one slow week of closings, one cluster of high-end properties can move a monthly average by tens of thousands of dollars in markets where 25 to 50 homes trade. Over seven months, those fluctuations wash out. What remains is direction.
July brought a seasonal pullback from June across all three markets, with Stratford seeing the sharpest deceleration after an unusually strong June. The monthly numbers below capture that short-term movement, and they're worth reading. But the January-to-July comparison against the same window in 2025 is where the real picture lives.
The broad pattern: Stratford's cumulative volume is running 7.5% ahead of 2025, with overall pricing down less than 1%. Perth County's freehold market is quietly growing in both volume and value, with list-to-sell ratios holding at 98%. Woolwich and Wellesley's price recalibration is real but appears to be stabilizing.
Stratford: Strong year, quieter July
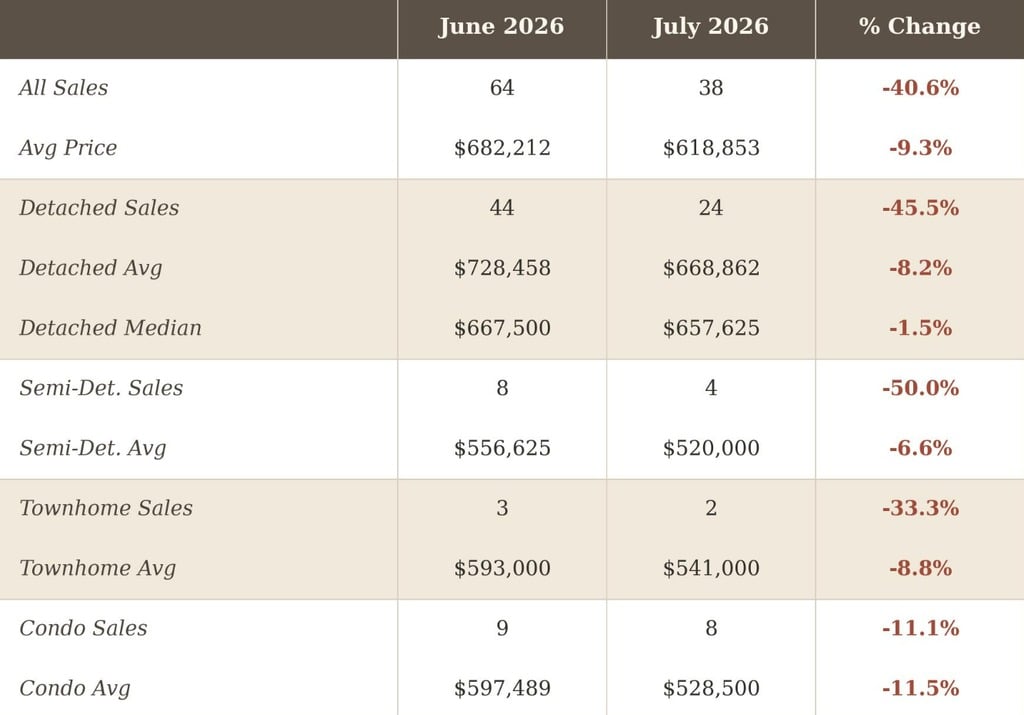
38 sales in July, down from June's 64 (the busiest month of 2026 so far). That 40.6% month-over-month decline looks steep, and it is. July also trailed July 2025, which saw 43 sales. The seasonal pullback from a strong June is expected, but the size of the drop tells us June was exceptionally active rather than July exceptionally slow.
The average sale price came in at $618,853, down from June's $682,212 (a 9.3% decline). June benefited from a concentration of higher-value detached closings, particularly at the upper end of the range, so the giveback is not surprising. The median sat at $573,947, down from June's $610,500 but within the corridor this market has traded in all year.
Through seven months, 285 homes have sold at an average of $634,863, compared to 265 at $640,179 in the same window of 2025. Volume up 7.5%, pricing down just 0.8%. That's a healthy market by any definition: more homes trading at essentially the same prices.
Detached: The anchor holds
24 detached homes sold in July at an average of $668,862, pulling back from June's 44 at $728,458. The median eased slightly to $657,625 from $667,500. With June having been the strongest detached month of the year, a quieter July follows naturally.
Year-to-date: 186 detached sales at $679,908, compared to 184 at $672,128 through seven months of 2025. Volume up 1.1%, pricing up 1.2%. This is flat by any honest measure. Essentially the same number of homes trading at essentially the same prices.
Condos: More activity, lower prices
8 condo sales in July at a $528,500 average, nearly matching June's 9 transactions. This is the most consistent condo activity of 2026. Through seven months, 43 condos have sold at $529,967, compared to 32 at $576,485 over the same period in 2025. Volume is up a notable 34.4%, while pricing has softened 8.1%. More condos are moving, but at lower price points. This isn't a collapse in the segment; it's a repricing that is attracting more buyers.
Semi-detached and townhomes
Semi-detached: 4 sales at $520,000 in July, down from June's 8 at $556,625. Year-to-date, 35 sales at $546,329 (vs. 32 at $560,575 in 2025) shows volume up 9.4% with pricing down a modest 2.5%. This segment continues to offer the entry point into freehold ownership, and buyers are taking it.
Townhomes had a quiet July: 2 sales at $541,000. Year-to-date, 15 at $558,409 versus 17 at $569,462 (down 1.9% in average price). With so few monthly transactions, individual home characteristics drive these numbers more than any broader pricing trend.
Stratford: June vs. July 2026
Stratford: Seven-month cumulative, January to July
Seven months of data smooths out the noise of any individual month. This is the table to anchor to.
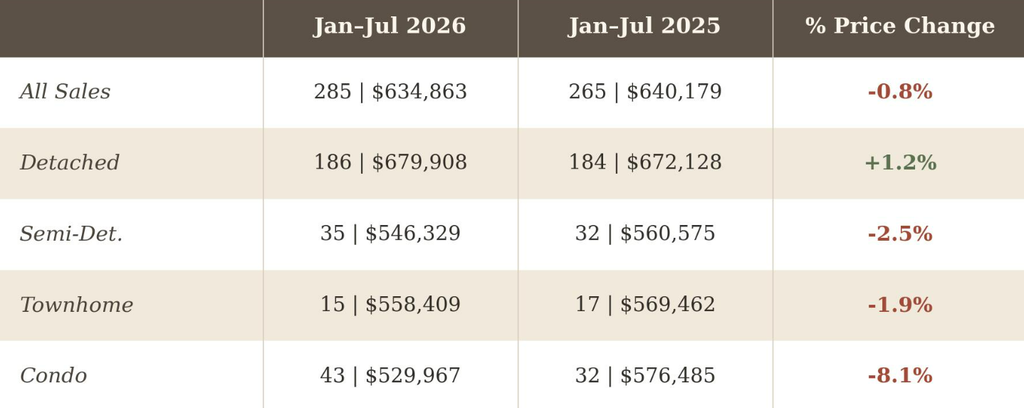 Sales volume up 7.5% year-over-year (285 vs. 265). July 2026 vs. July 2025: 38 vs. 43 sales (−11.6%).
Perth County: Steady volume, steady pricing
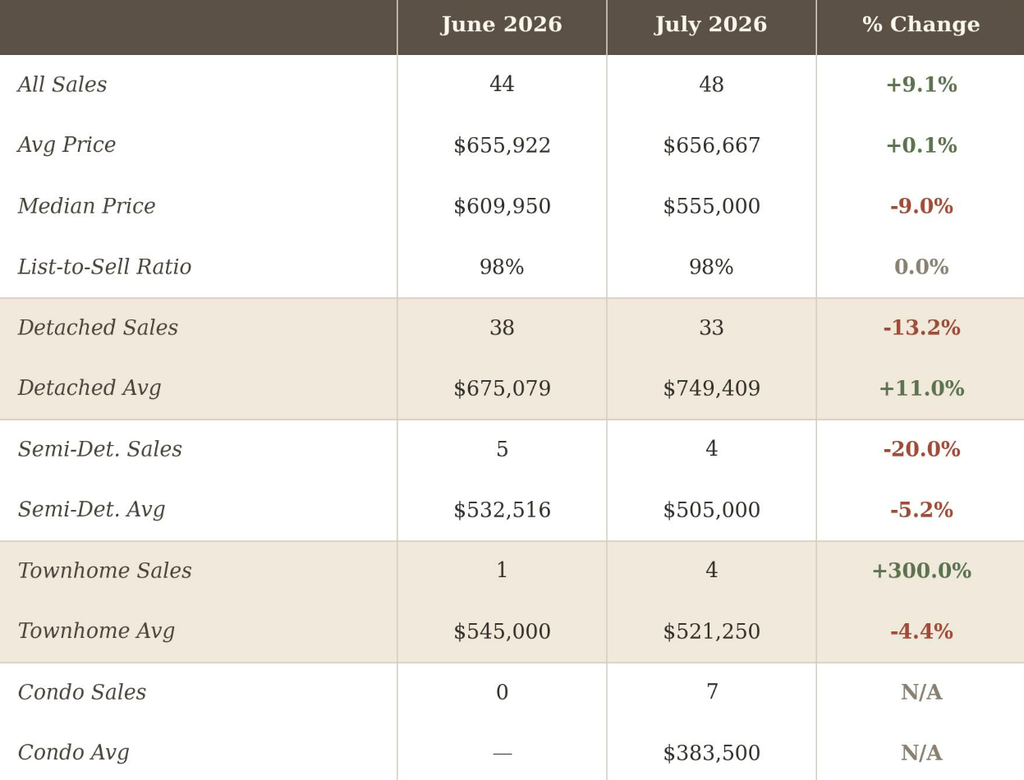
Perth County excluding Stratford recorded 48 sales in July, up from 44 in June (+9.1%). The average price held virtually flat at $656,667 (from $655,922). The list-to-sell ratio stayed at 98%, consistent with the first half of the year. This is a market in a settled rhythm: buyers are active, sellers are pricing realistically, and the two sides continue to meet close to asking.
The median dropped from $609,950 to $555,000 (down 9.0%), which tells us the composition of what sold in July skewed toward lower price points. The average held steady because a few higher-value detached sales kept the overall figure level, but the centre of gravity in July sat lower than June. That's a normal monthly variation in a county where property types range from village homes to rural acreages.
Segment detail
Detached sales dipped from 38 to 33, but the average rose from $675,079 to $749,409 (+11.0%). Fewer transactions at a higher average tells us the properties that closed in July were weighted toward the upper range. Semi-detached had 4 sales at $505,000 (from 5 at $532,516). Townhomes showed a burst of activity: 4 sales versus just 1 in June, at $521,250.
Condos made a notable appearance: 7 sales at $383,500 after zero in June. With active listings at 66 for the month, the market has inventory to move, and at a 98% LSR, what is moving is trading close to asking.
Perth County: June vs. July 2026
These figures reflect Perth County excluding Stratford.
Perth County: Seven-month cumulative, January to July
The cumulative view tells the steadier story. Freehold pricing is essentially flat year-over-year, with volume growing meaningfully.
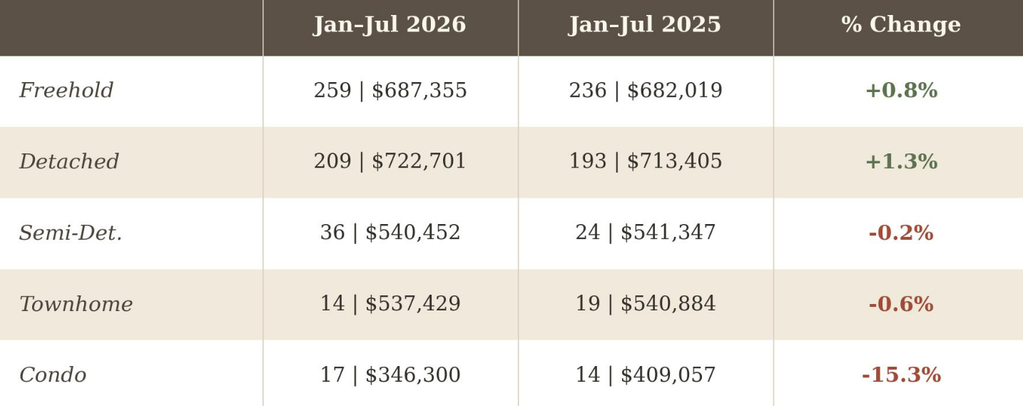
Perth County figures exclude Stratford. Freehold volume up 9.7% YoY (259 vs. 236). July 2026 LSR: 98%.
The freehold composite tells the story worth anchoring to: 259 sales at $687,355, compared to 236 at $682,019 (up 0.8%). Volume has grown 9.7% while pricing sits essentially flat. Buyers are active, and they're paying close to what buyers paid last year.
Detached homes remain the largest segment: 209 sales at $722,701, up 1.3% from $713,405 over 193 sales in 2025. Semi-detached volume has grown sharply (36 vs. 24, up 50%) with pricing essentially unchanged at $540,452 (down just 0.2%). This segment has become the value play of the county, and buyers have found it.
Townhome volume remains lower than last year (14 vs. 19, down 26.3%), though pricing is nearly flat ($537,429 vs. $540,884). The drop appears to be supply-driven rather than demand-driven. Condo pricing continues to soften: $346,300 versus $409,057 (down 15.3%), similar in direction and magnitude to the Stratford condo market.
Woolwich and Wellesley: Composition, not collapse
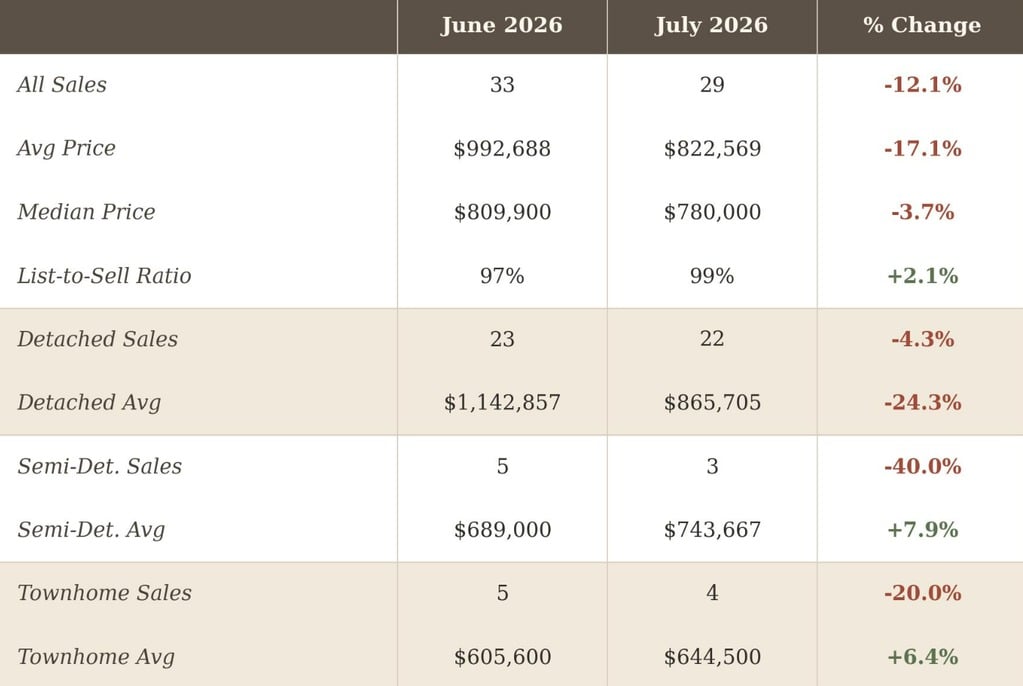
29 sales in July, down from June's 33 (a 12.1% decline). The average dropped from $992,688 to $822,569, a 17.1% month-over-month fall that is the sharpest single-month move in any of our three markets. The headline number deserves immediate context.
With 22 detached sales in July versus 23 in June, volume was nearly identical. The difference is what sold. June included a cluster of sales above $1.5 million; July's detached average of $865,705 reflects a mix concentrated in the $700,000 to $900,000 range. Meanwhile, the list-to-sell ratio actually ticked up to 99% from 97%, which tells us homes that sold were priced well. This isn't distress selling. It's a different composition of properties reaching the closing table.
The median eased more gently: $809,900 to $780,000 (down 3.7%). As always, the median is the better gauge of where the typical transaction sits, and a 3.7% decline is well within normal monthly variation.
Detached: Volume steady, composition shifted
The detached average of $865,705 in July compares to $1,142,857 in June (down 24.3%). With nearly the same number of transactions (22 vs. 23), this is purely about which homes closed, not about weakening demand. Year-to-date, 153 detached sales at $1,010,410 versus 154 at $1,153,577 (down 12.4%). Volume is virtually identical; the pricing adjustment of roughly one-eighth is real and sustained.
Smaller segments
Semi-detached: 3 sales at $743,667 in July. Year-to-date, 13 vs. 21 (down 38.1%), with pricing off 7.0%. This segment is thin enough that a few transactions either direction change the annual story.
Townhomes continue as the growth segment: 4 sales at $644,500 in July. Year-to-date, 20 vs. 14 (up 42.9%), with pricing flat at $675,010 vs. $679,707 (down 0.7%). More buyers are choosing townhomes in Woolwich and Wellesley, and they're paying the same prices as last year's buyers.
Woolwich and Wellesley: June vs. July 2026
Woolwich and Wellesley: Seven-month cumulative, January to July
The seven-month view provides the steadiest read on the recalibration this market has been working through since early this year.
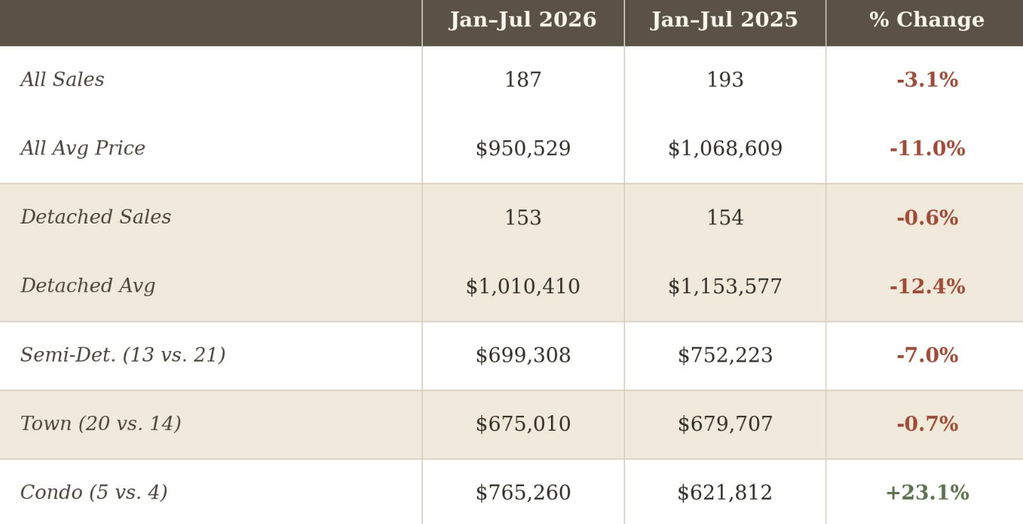
Sales volume is down 3.1% year-over-year (187 vs. 193), a modest decline. Pricing is down 11.0% overall, widening slightly from the 10.7% gap reported through six months. The correction hasn't reversed, but the pace is barely moving: a 0.3 percentage-point widening over an entire additional month. That reads as stabilization.
Detached volume is virtually flat (153 vs. 154), confirming that buyers haven't stepped away. They've recalibrated. The 12.4% price adjustment is structural: it has been consistent enough over seven months that it reflects a genuine resetting from the price levels of late 2024 and early 2025, not a seasonal anomaly.
Townhomes remain the standout: 20 vs. 14 sales (+42.9%) at essentially flat pricing. This segment is offering value relative to detached and buyers are responding. Semi-detached volume is notably lower (13 vs. 21), though limited supply rather than limited demand appears to be the driver.
What seven months of data tells us
Seven months is long enough to identify patterns with confidence and short enough that the data remains current. The picture across our three markets:
Volume is holding or growing
Stratford is up 7.5% in sales year-to-date. Perth County freehold sales are up 9.7%. Woolwich and Wellesley shows a modest decline of 3.1%, within normal variation for a market of that size. Buyers are present, active, and transacting. The narrative that the market is frozen doesn't hold.
Pricing sits within a known range
Stratford is down just 0.8% on overall average, with detached actually up 1.2%. Perth County freehold is up 0.8%. Woolwich and Wellesley carries a larger adjustment at 11.0%, reflecting a correction from price levels that had moved aggressively through 2024 and early 2025. In all three markets, the detached segment (the largest share of transactions) is close to or above 2025 pricing: up 1.2% in Stratford, up 1.3% in Perth, down 12.4% in Woolwich and Wellesley.
List-to-sell ratios remain healthy
Perth County's 98% LSR in July matches June and continues the pattern from the first half of the year. Woolwich and Wellesley ticked up to 99%. Stratford's July LSR came in at 99%, up from 98% in June. Across all three markets, sellers who price to current conditions are achieving close to asking. These are functional, balanced markets.
The condo market continues to soften across markets
Stratford condos are down 8.1% in average price year-to-date, though volume is up 34.4%, suggesting lower prices are drawing buyers in. Perth County condos are down 15.3%. Both markets show condo pricing settling at a lower level than 2025. This creates opportunity for buyers who see value at current price points, and pressure for sellers who anchored expectations to last year's figures.
For sellers
Price to the data, not to memory. Woolwich and Wellesley's 11% year-over-year adjustment is real and sustained; sellers in that market who haven't recalibrated are sitting on the market while correctly priced homes sell at 99% of asking. Stratford and Perth County offer a simpler message: the market is stable, list-to-sell ratios are healthy, and homes priced to current conditions are moving. The seven-month trend gives you a reliable basis for setting expectations.
For buyers
Conditions continue to favour patient, prepared buyers. Inventory is available across all three markets. Woolwich and Wellesley's price recalibration has created genuine value relative to 2025 pricing. The federal and provincial incentive framework for new builds remains in place. The data is there to make informed decisions; use it.
Looking ahead
August traditionally marks the tail end of summer selling season before the fall market activates in September. We'd expect volume to ease slightly, consistent with what we've seen in years past.
The seven-month trajectory gives us a reliable compass for the rest of 2026: healthy volume, recalibrated pricing, and a market that continues to function well for both sides when expectations match the data. The consistency of list-to-sell ratios in the high 90s across all three markets confirms that properly priced homes are finding buyers. The story to watch in the fall is whether Woolwich and Wellesley's price correction stabilizes or continues to widen.
Questions about what this means for your home or your next move? I'm here to talk it through.
Disclaimer: Market information and statistics referenced herein have been compiled from data published by The Toronto Regional Real Estate Board and other sources deemed reliable. While every effort has been made to ensure accuracy, the information is provided for general informational purposes only and is not guaranteed. Figures may be subject to revisions, reporting delays, or data-entry errors, and should not be relied upon as a substitute for professional advice. This communication is not intended to cause or induce a breach of an existing agency agreement. We do not solicit properties that are currently listed for sale or already under contract with another brokerage
Check out this article next